Great Barrier Reef sea floor data
Last updated:7 June 2023
New data shows the Great Barrier Reef's sea floor in unprecedented detail.
Combining historical and new sea floor mapping data, known as bathymetry, we have improved our view of the shape of the reef from 250m resolution to 30m resolution.
The data covers an area of 1.5 million square kilometres and will help us better understand the sea floor structure of the Great Barrier Reef. This will be used for preservation projects, tidal current and wave modelling and a range of other applications.
There are currently some 3000 identified coral reefs in the Great Barrier Reef Marine Park but we hope this data will help to discover even more, which will support management and conservation of the marine park.
We have made this Great Barrier Reef bathymetry data available to the public and plan to make similar high-resolution data available for large areas of Australia's Northern coastline in the next year.
Case study: Captain Cook and the Endeavour
When Captain Cook's ship the Endeavour first entered the Great Barrier Reef on 20 May 1770, Cook found an 'insane labyrinth' of coral. The ship ran aground on what is now called Endeavour Reef.
Captain Cook made painstaking maps of the region, such as this section from Cape Tribulation to Cape Flattery.
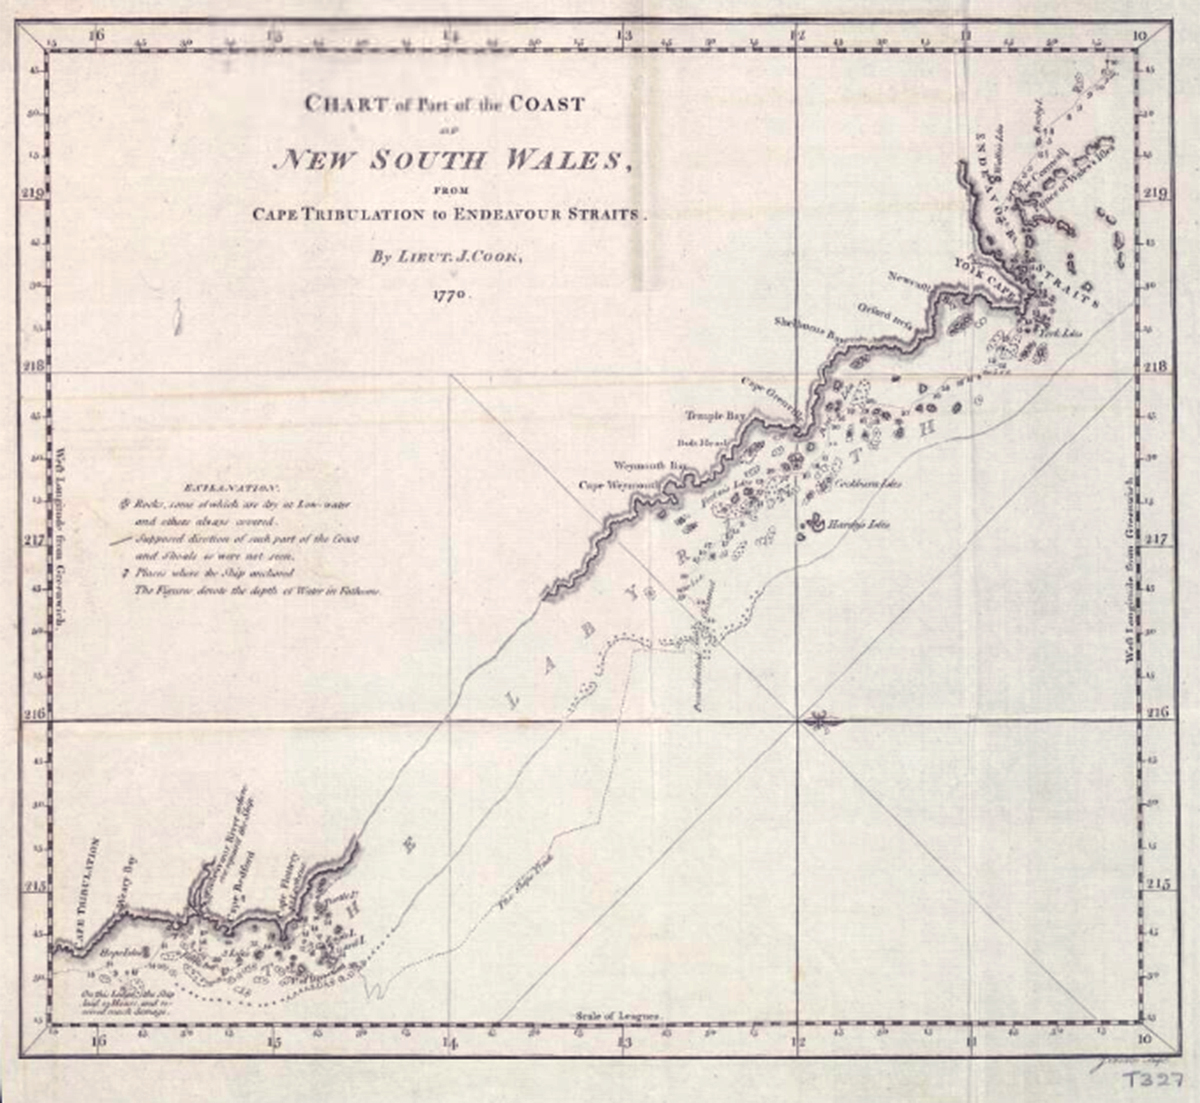
Captain Cook's map of the Great Barrier Reef, from Cape Tribulation to Cape Flattery
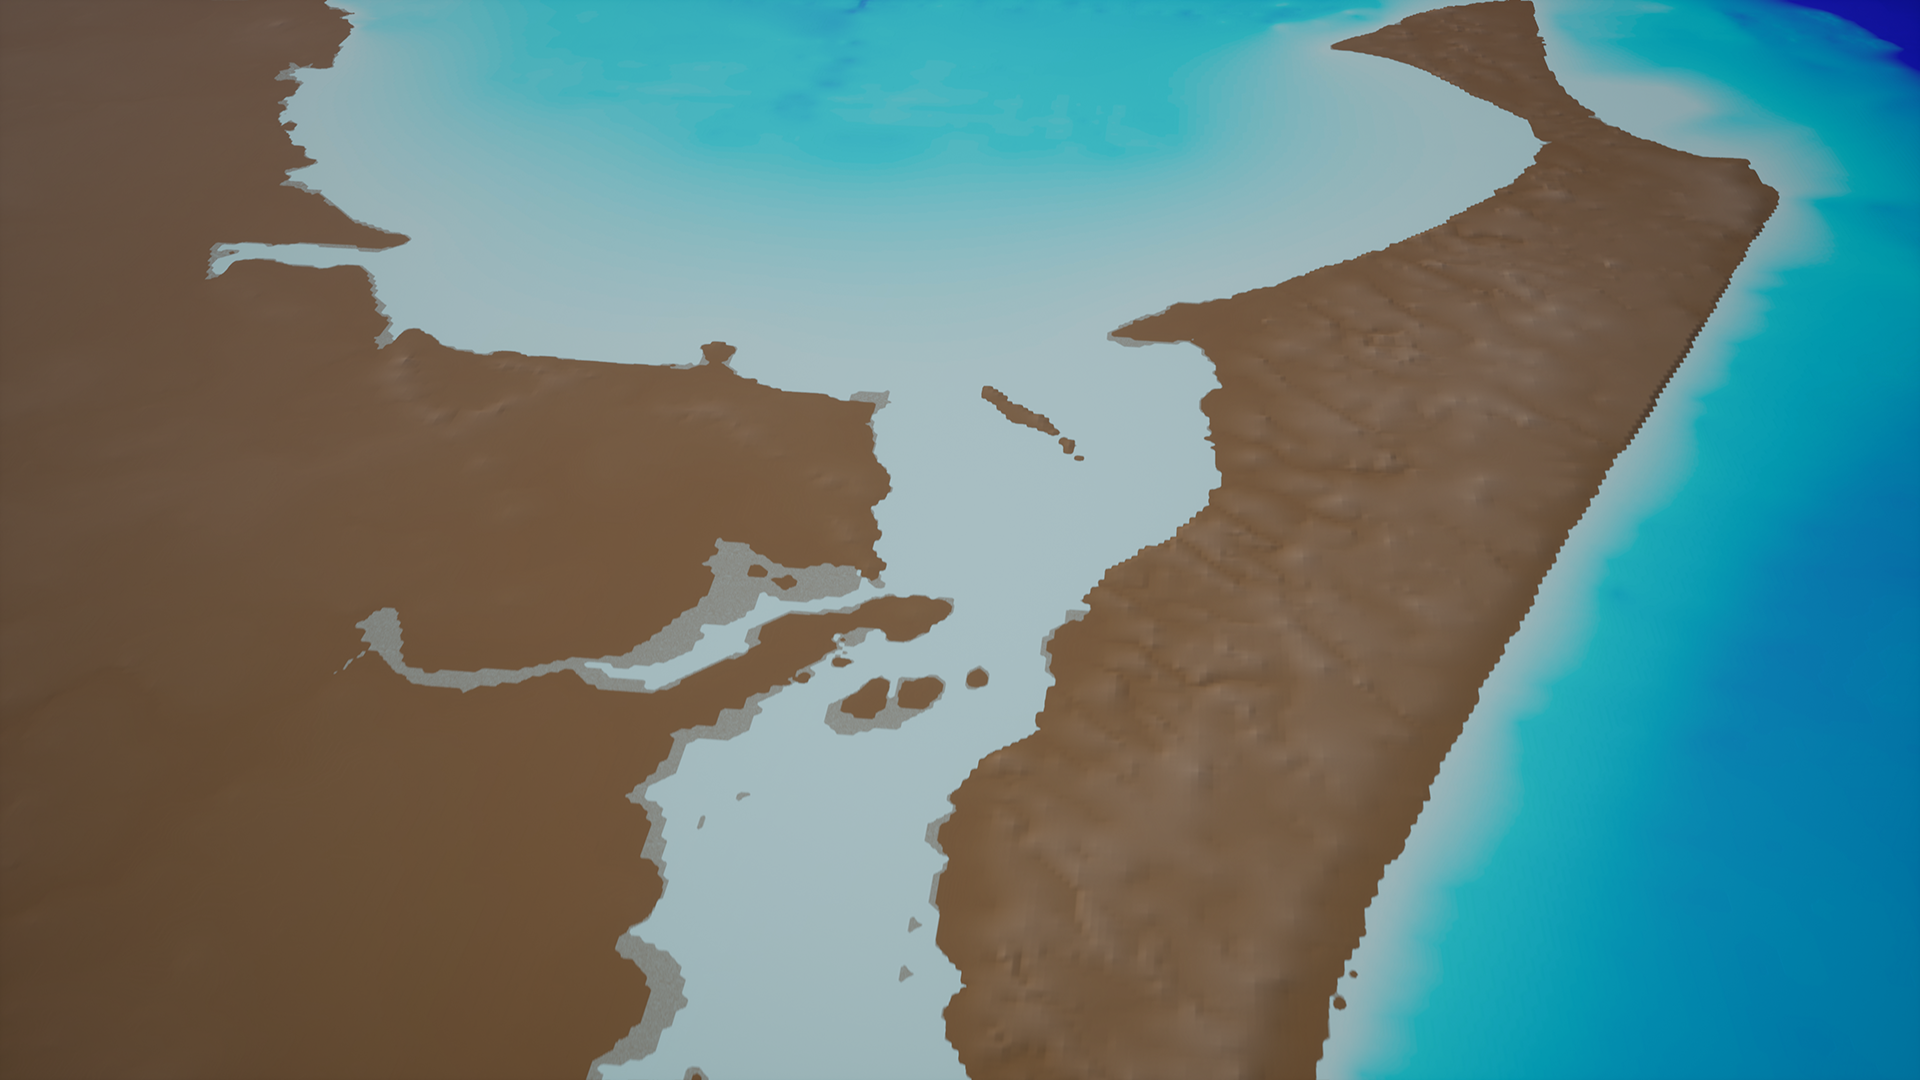
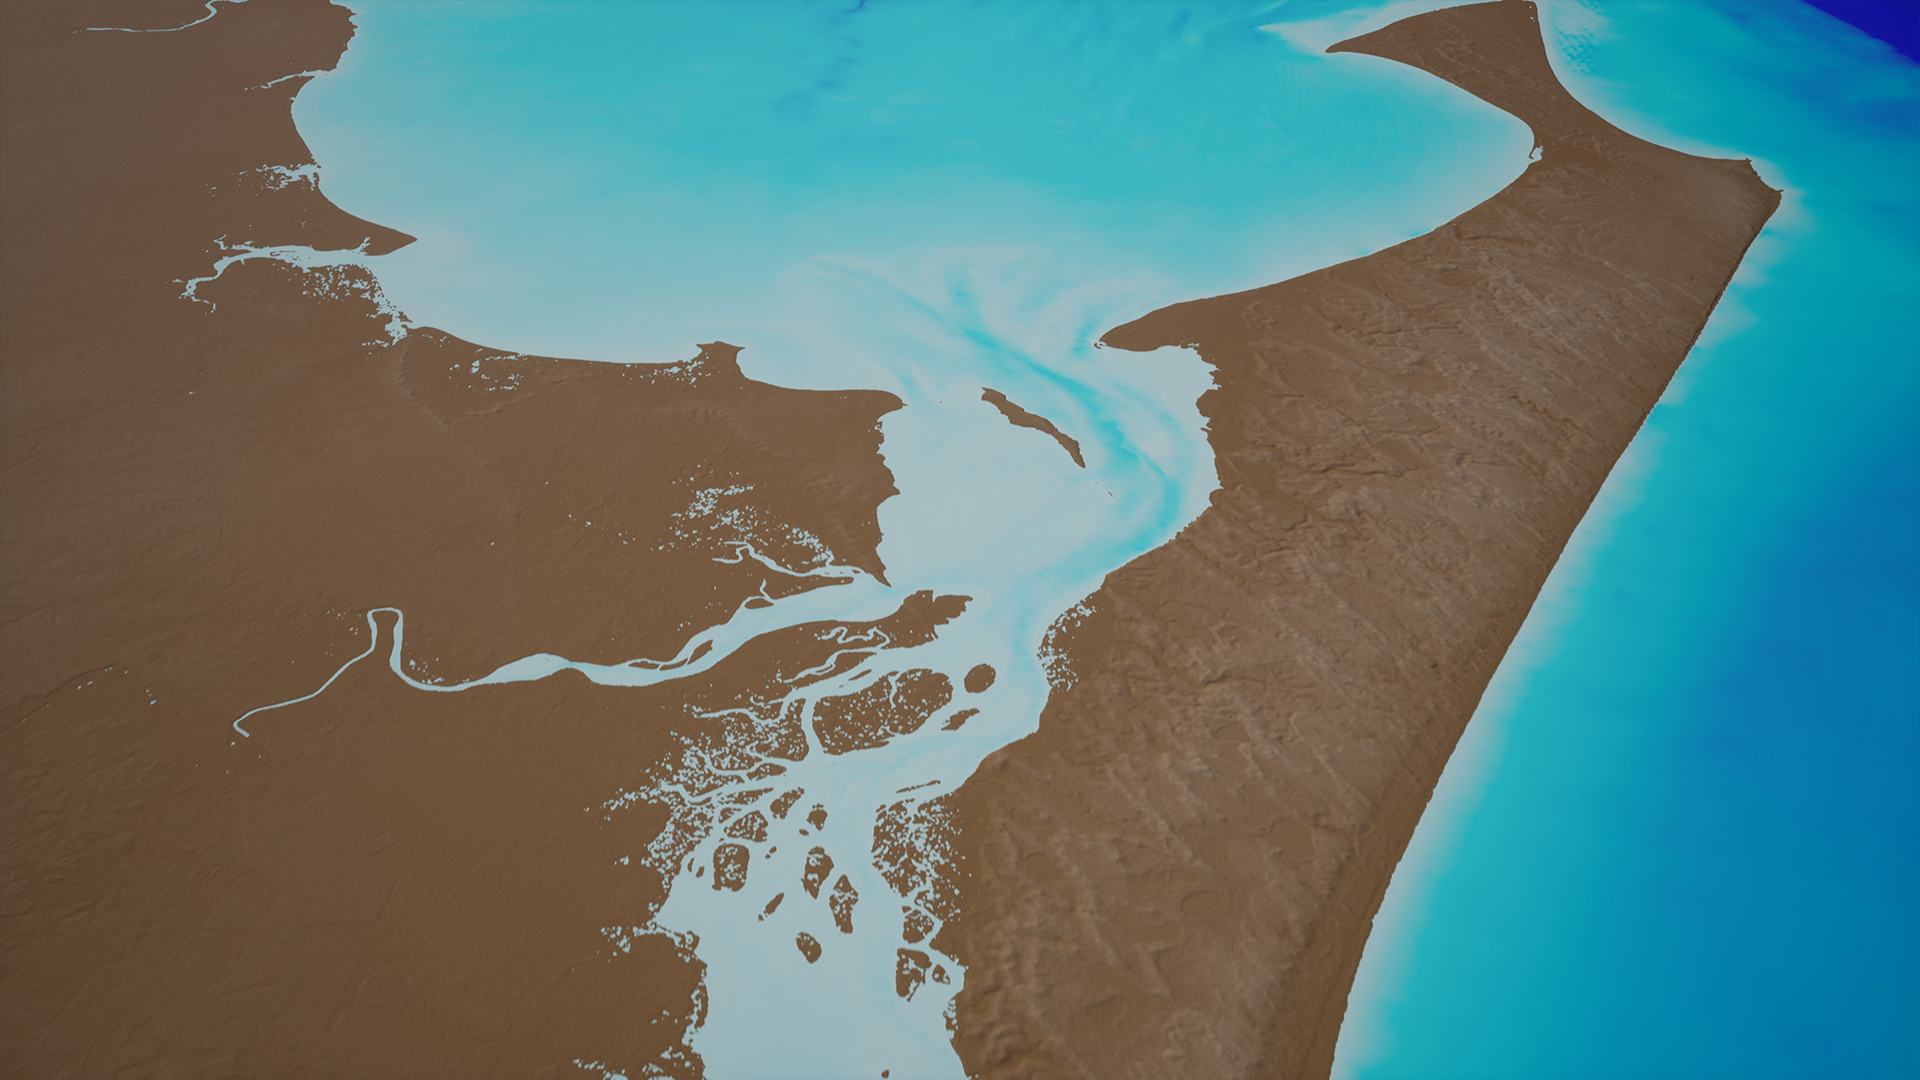
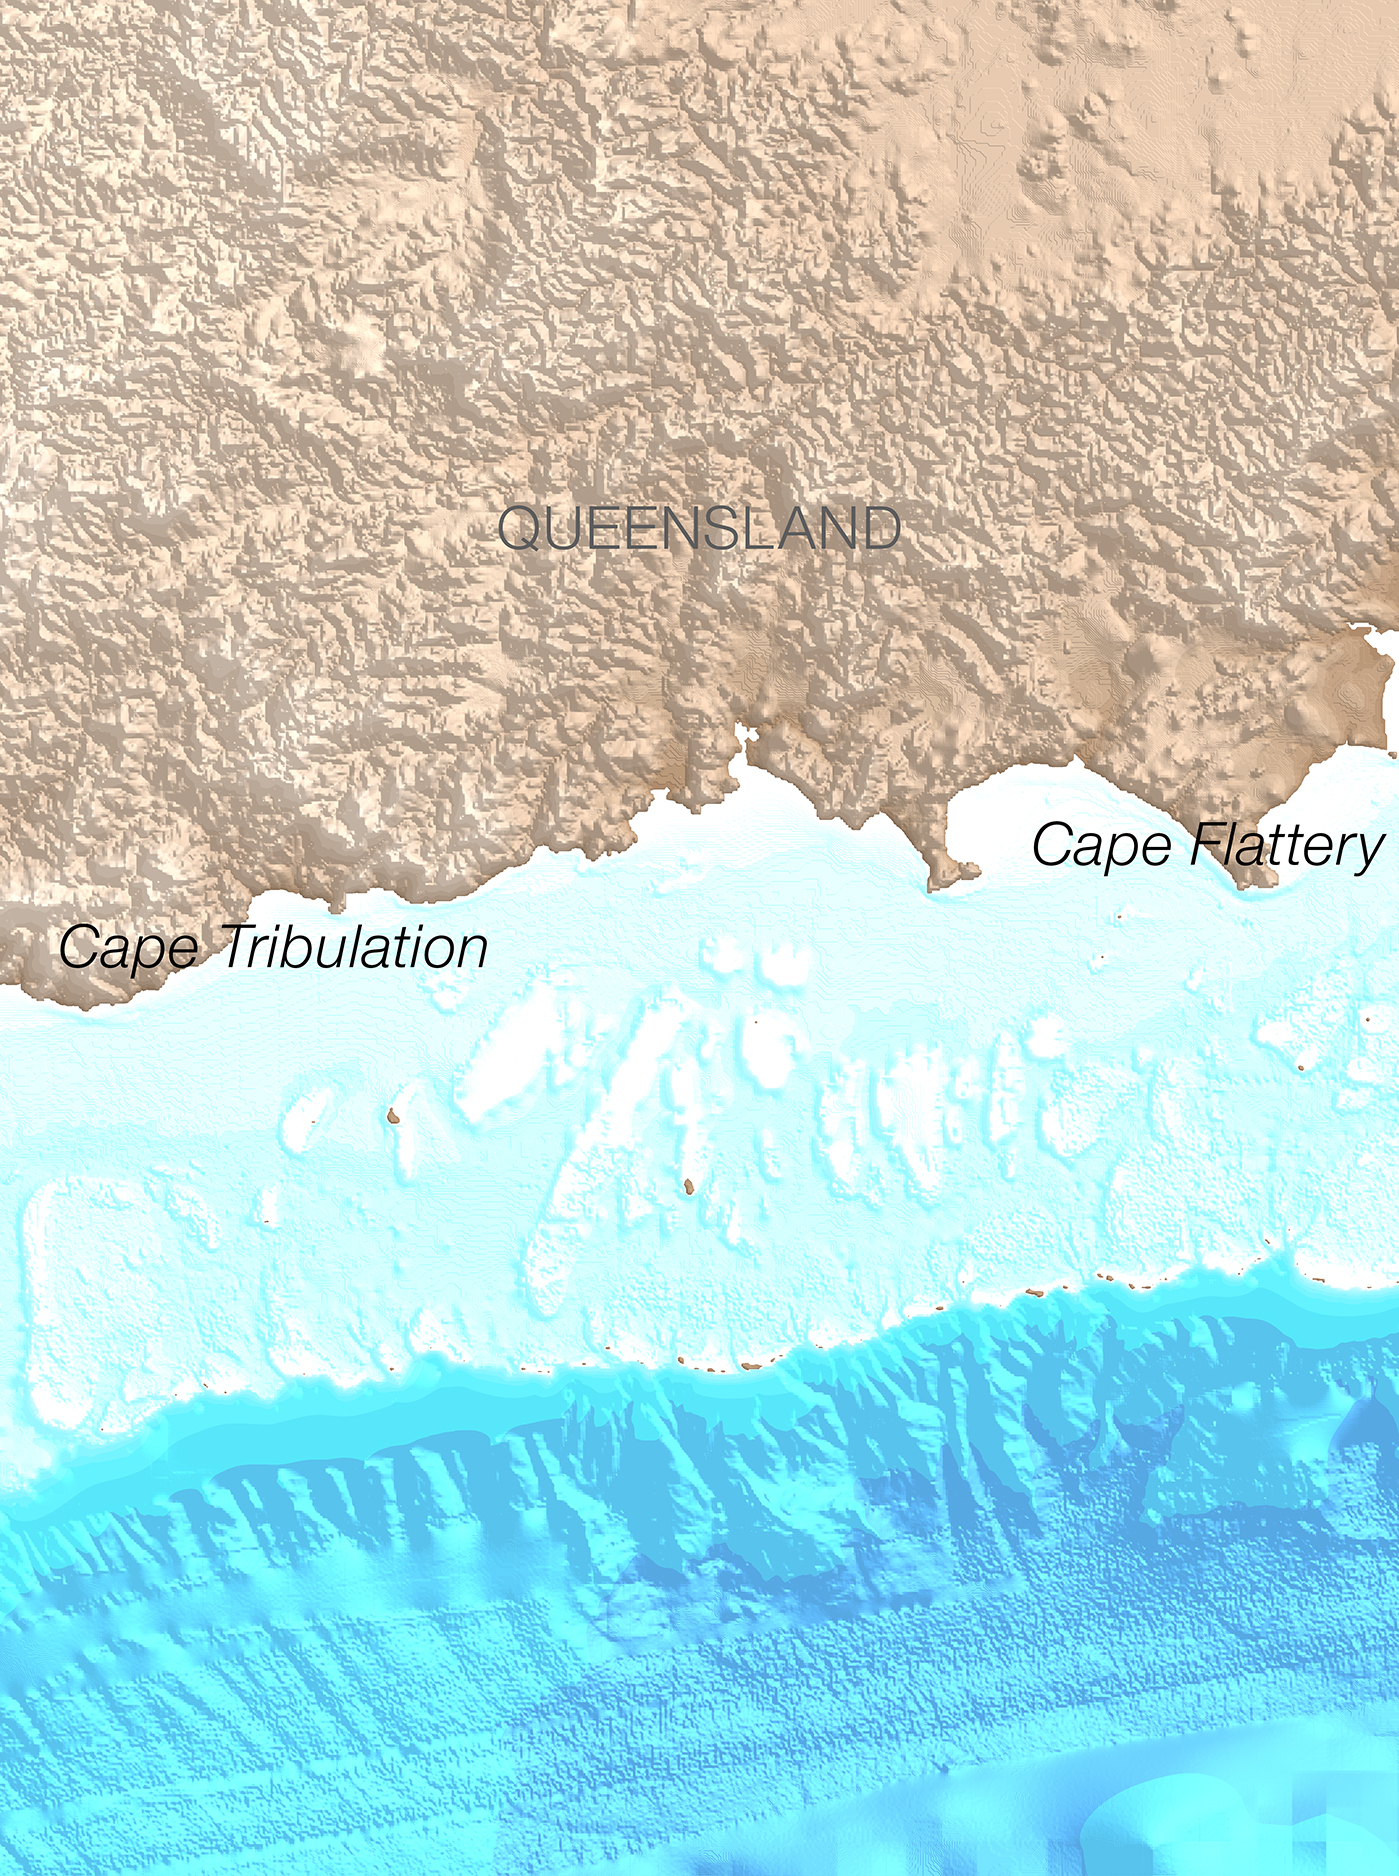
In 2009, we had 250 m bathymetry grids of this area. The new 30m bathymetry grids of this region show it in extraordinary detail.
250 m bathymetry data of the Great Barrier Reef, from Cape Tribulation to Cape Flattery
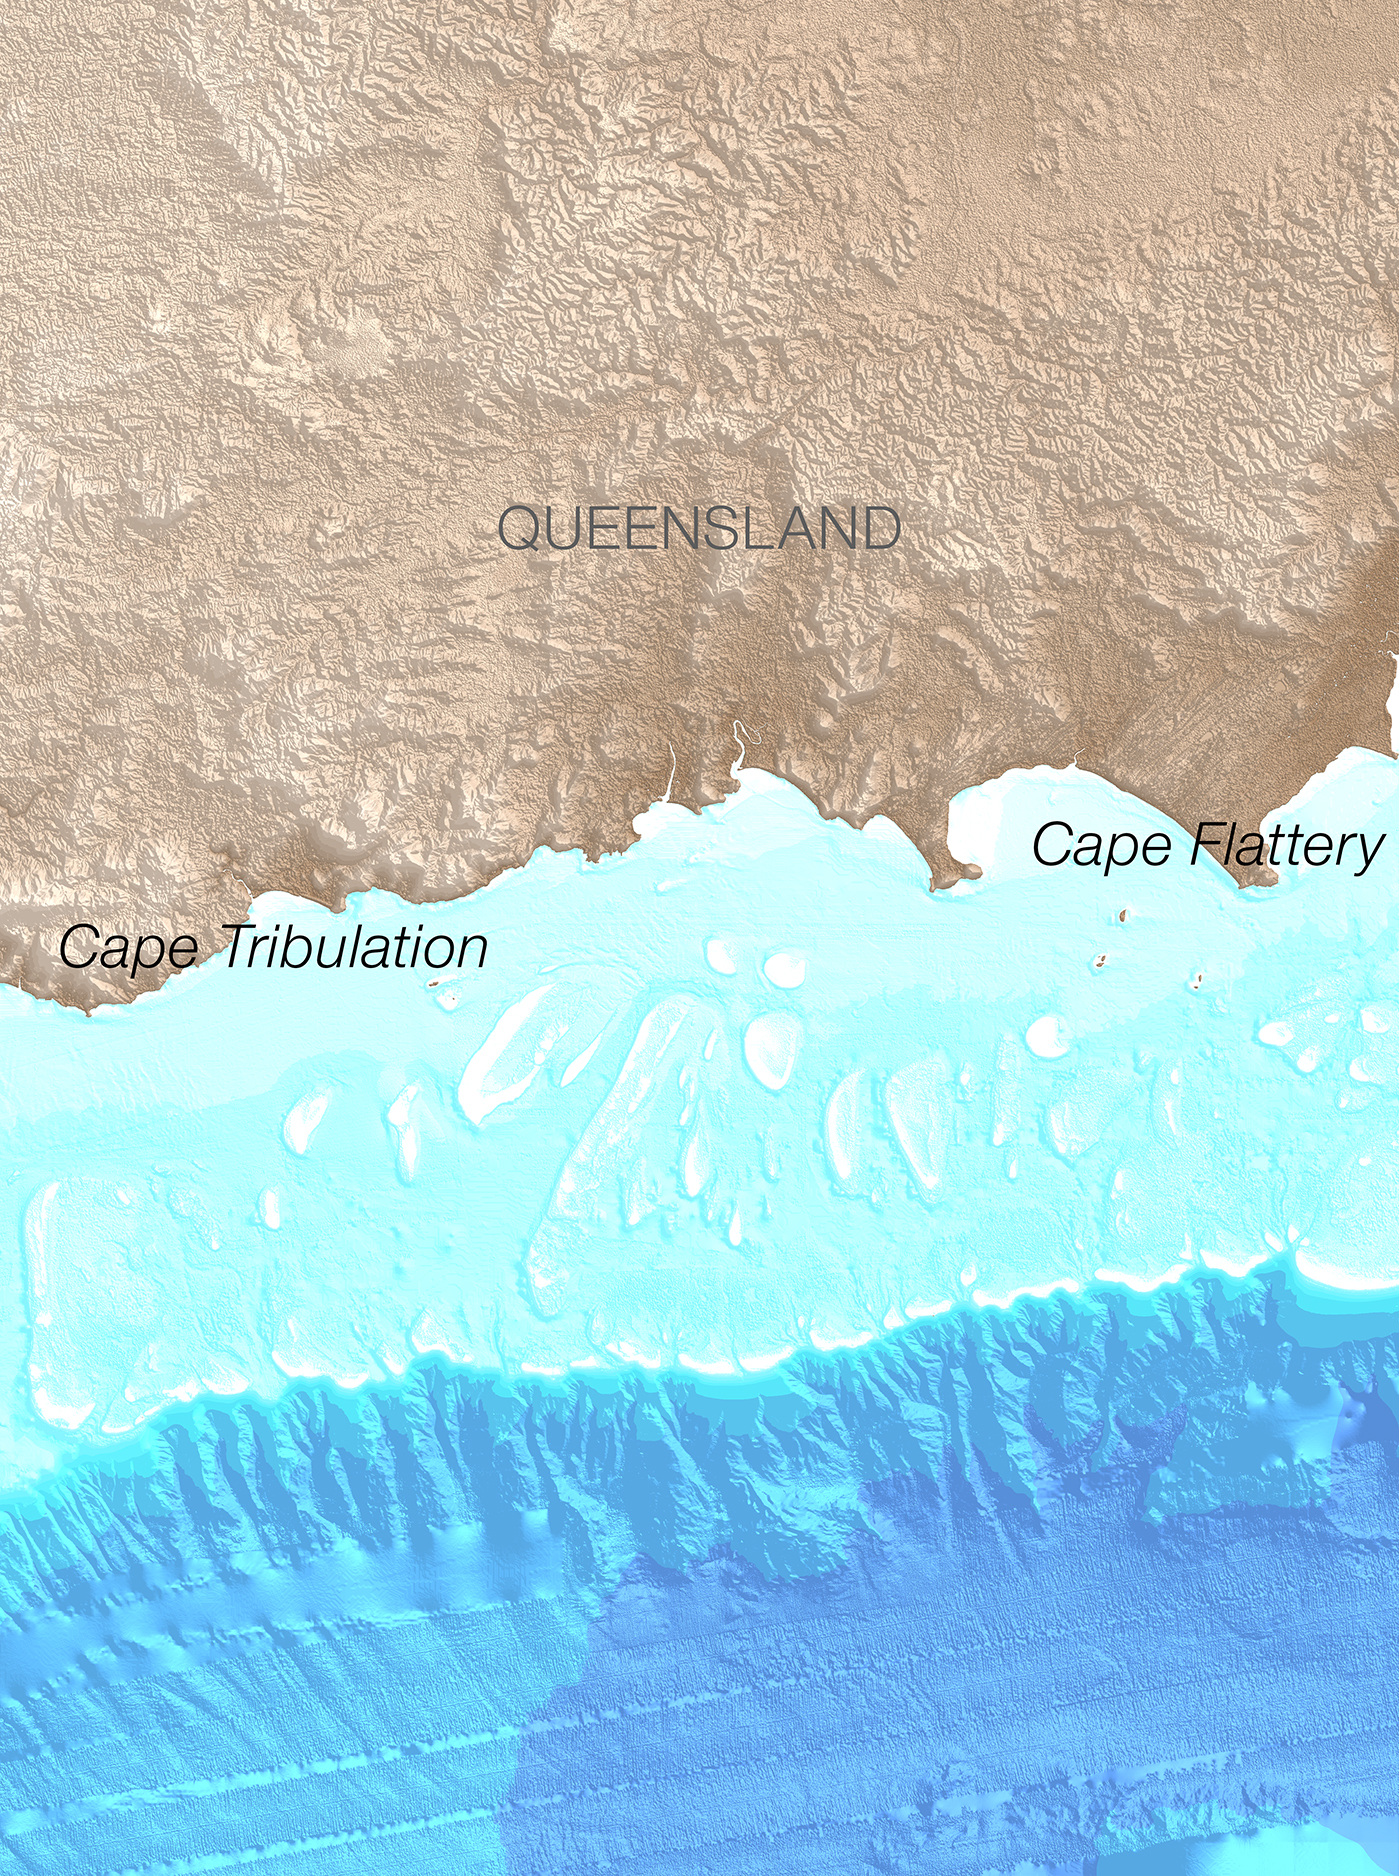
30 m bathymetry data of the Great Barrier Reef, from Cape Tribulation to Cape Flattery
The project
This data is the first of a range of datasets that will provide 30m bathymetry grids around large parts of the Australian coastline.
Geoscience Australia, James Cook University and the Australian Hydrographic Service have worked together as part of a four-year project to provide legal certainty for Australia's maritime boundaries. This project collated millions of dollars' worth of existing datasets from government sources including the Australian Hydrographic Service, along with new data.
This work also demonstrates what we can achieve by combining data and making it openly available.
This sea floor data can be used for policy, planning and scientific work. For example, this data is an important input for oceanographic modelling, which we can use to enhance our knowledge of climate change impacts, marine biodiversity, and species distribution.
It will also improve modelling of tides and ocean currents, including helping to better predict storm surges on the coast.